Output Formats
The--format flag controls the output format. Five formats are available, and they can be combined (e.g. --format jsonl,html):
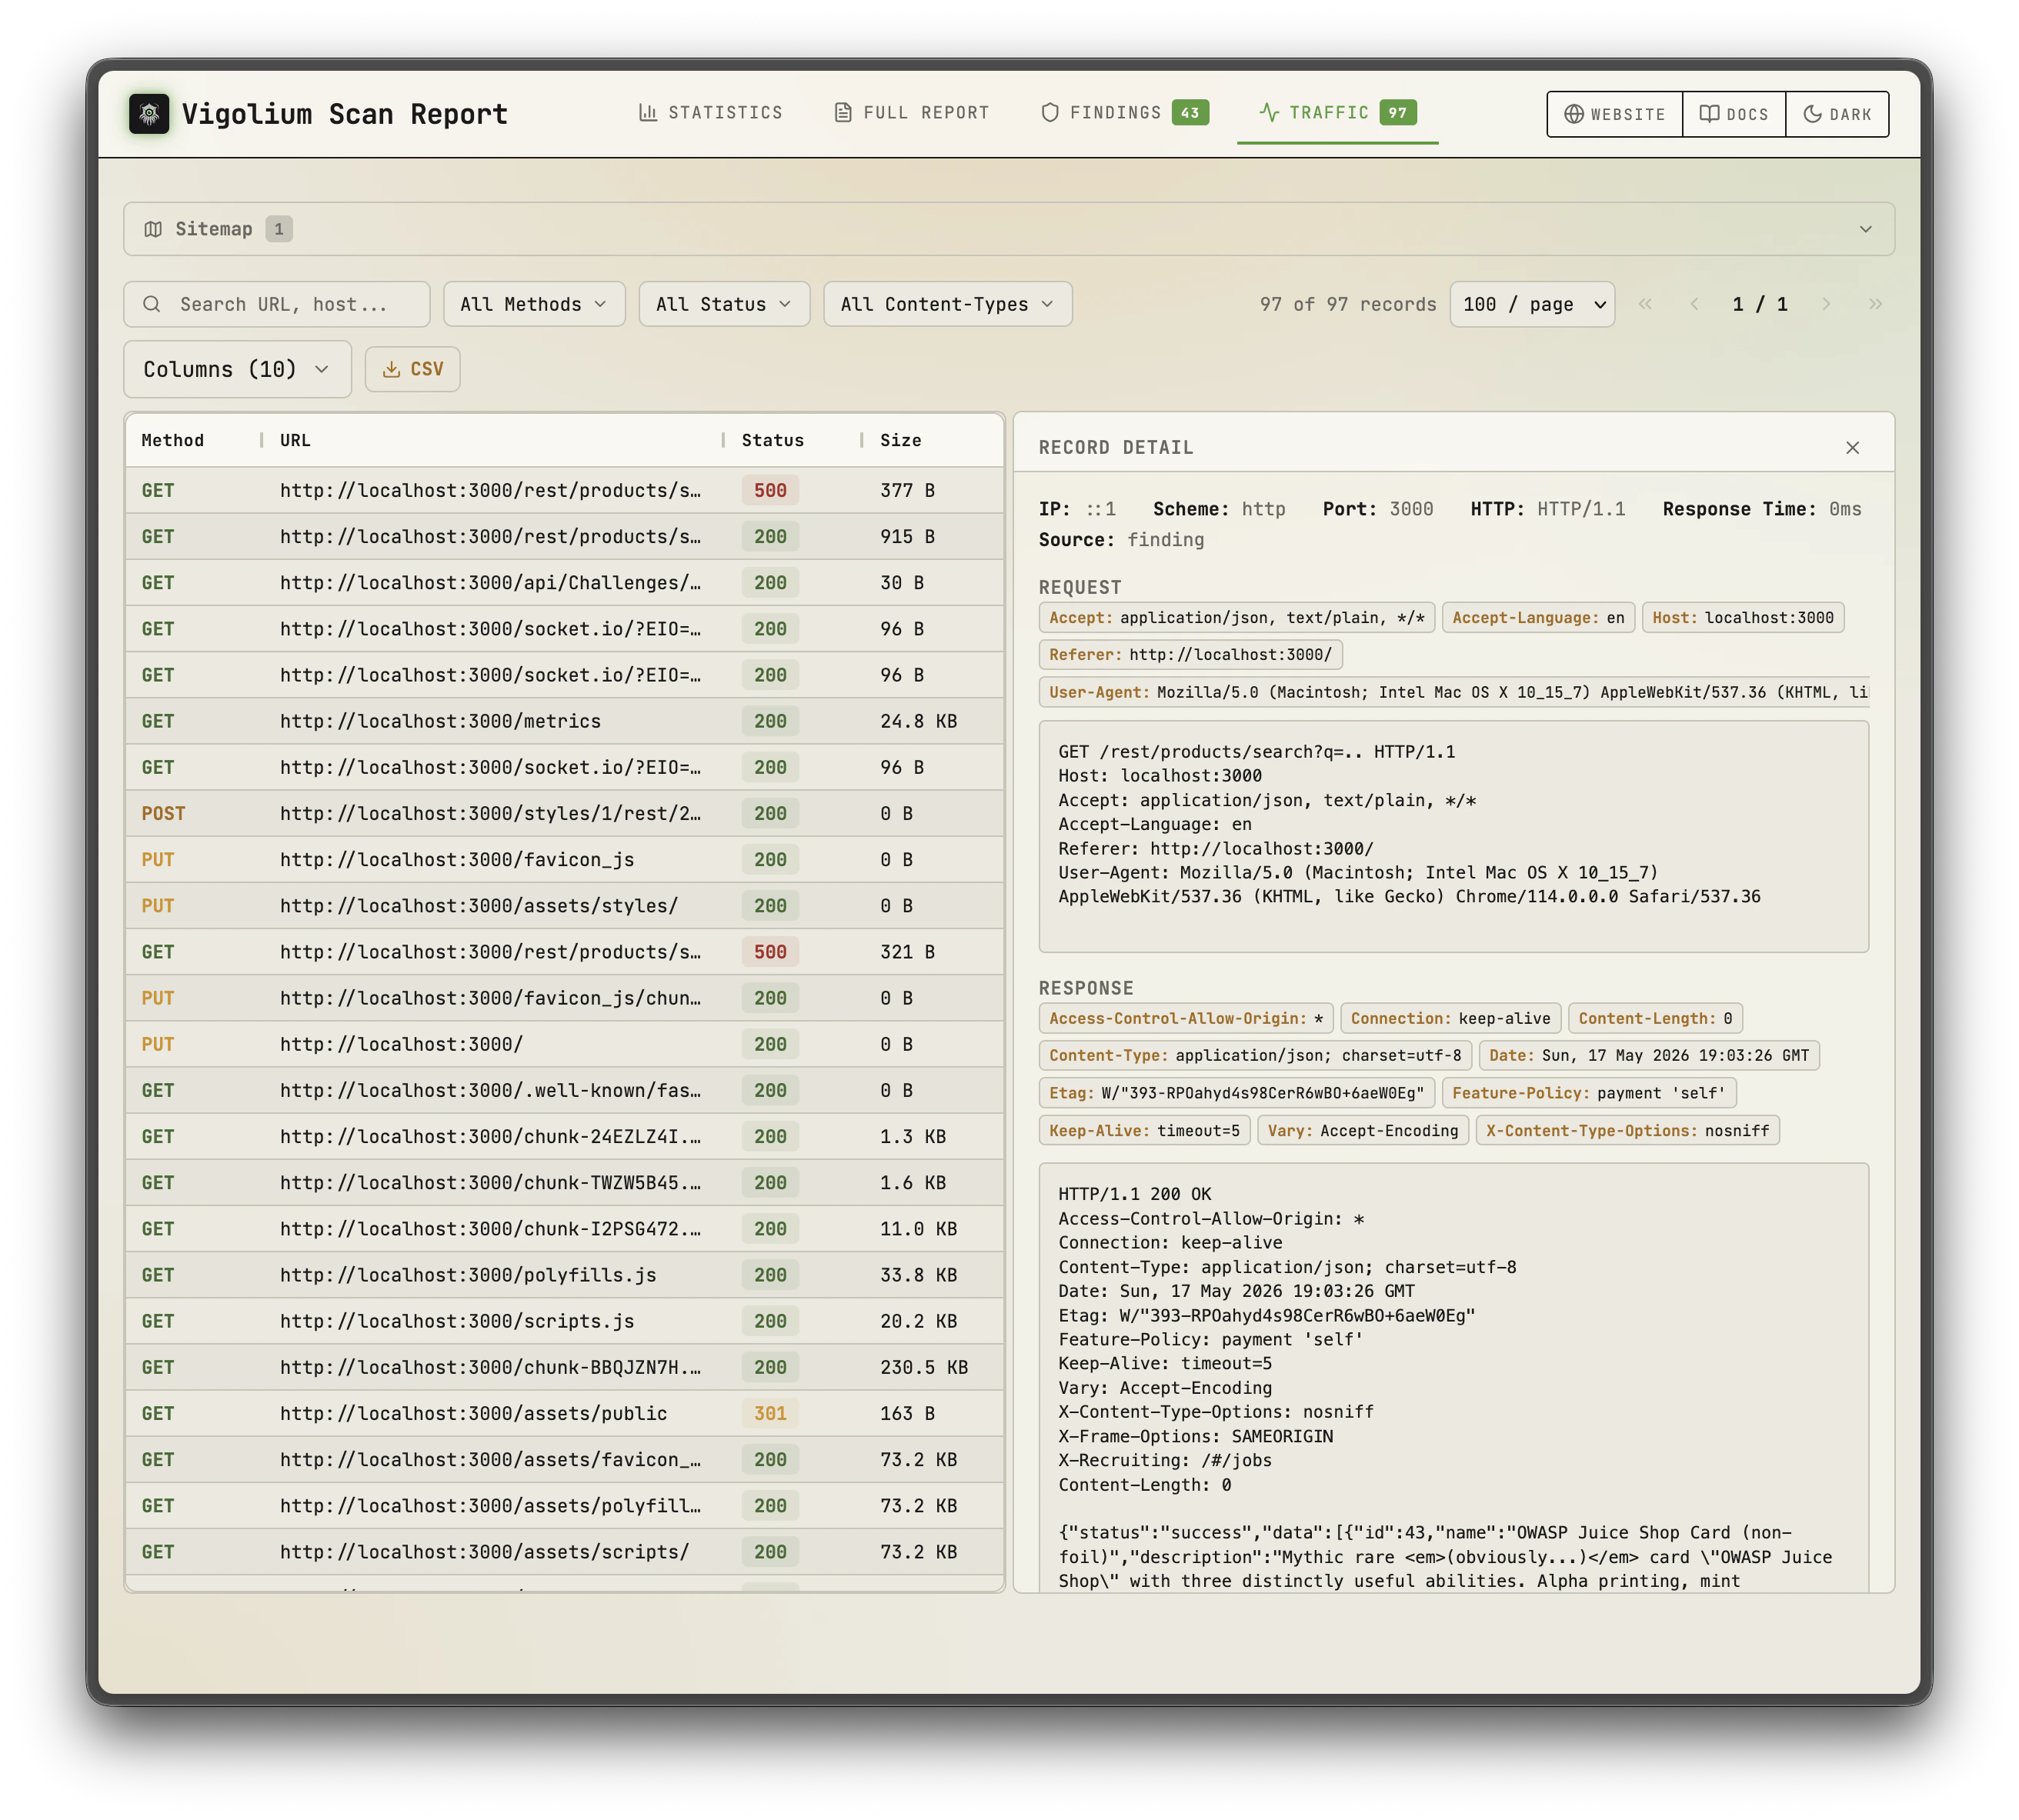
Console (default)
--format flag is specified.
Severity colors:
- Critical: Red
- High: Orange/Yellow
- Medium: Yellow
- Low: Blue
- Info: Gray
JSONL
jq, ingesting into SIEMs, or processing with custom scripts.
Example usage with jq:
--ci-output-format is a shorthand that forces clean JSONL with no banners or color codes, drop-in safe for parsing in build scripts:
HTML
-o/--output flag is required when using HTML format.
HTML format is supported for:
- Scan results (findings)
- Discovery phase output (discovered URLs and endpoints)
- Spidering phase output (crawled pages)
SQLite
<output>.sqlite (via SQLite VACUUM INTO), producing a single self-contained file you can reopen later with vigolium finding/traffic (see Reading a Standalone Export). Aliases: sqlite3, db.
- Requires
-S/--statelessand-o/--output. Stateless runs use a per-run temporary database, so “this scan’s SQLite” is well-defined; a persisted run writes into the shared project DB, where it would be ambiguous (usevigolium exportfor that). - Combines with other formats:
--format sqlite,html -o scanwrites bothscan.sqliteandscan.html. - Under
--split-by-host, each per-host file is named<base>-<host>.sqlite.
Filesystem (fs)
ls/grep/jq, no database required. Two sibling directories are written off the -o base (defaulting to vigolium in the current directory when -o is omitted), so -o run yields run-traffic/ and run-findings/:
- Per-host ids are zero-padded and assigned in
sent_atorder, so re-exports are reproducible. - Each
<id>.reqstarts with an@target <scheme>://<authority>line followed by the raw request verbatim — strip line 1 and it replays directly. index.jsonis the entry point: onejqover it maps every id to its url/status and to the file holding the bytes. On a traffic row, thefindingfield carries the top severity of any finding touching that request; each finding.mdlinks straight to the.req/.resp.*that proves it.- Available on
vigolium export,vigolium db export(honoring its filters), andscan/scan-url/scan-request/run— with or without-S/--stateless. - Honors
--omit-response(drops the.resp.*files).--split-by-hostis a no-op, sincefsalready splits by host.
The ingestion server can produce this same tree live with
vigolium server --mirror-fs <dir> — see Running the Server.Severity Scale
Findings are classified using five severity levels:| Severity | Description |
|---|---|
| Critical | Exploitable vulnerabilities with severe impact (e.g., RCE, SQL injection with data exfiltration) |
| High | Significant vulnerabilities that can lead to data compromise or unauthorized access |
| Medium | Vulnerabilities that require specific conditions to exploit or have limited impact |
| Low | Minor issues with minimal security impact |
| Info | Informational findings, such as technology fingerprints or configuration details |
Confidence Scale
Each finding includes a confidence level indicating the reliability of the detection:| Confidence | Description |
|---|---|
| Certain | Confirmed with proof. The scanner has verified the vulnerability through direct evidence (e.g., a reflected payload executed, data was extracted). |
| Firm | Strong evidence supports the finding. Multiple indicators confirm the issue, but direct proof of exploitation was not obtained. |
| Tentative | Based on heuristic or pattern matching. The finding may be a false positive and should be manually verified. |
Finding Structure
Each finding contains the following fields:| Field | Description |
|---|---|
| Module | The scanner module that produced the finding (e.g., xss-reflected, sqli-error-based) |
| Severity | Critical, High, Medium, Low, or Info |
| Confidence | Certain, Firm, or Tentative |
| URL | The target URL where the vulnerability was detected |
| Parameter | The specific parameter or insertion point that was tested (if applicable) |
| Evidence | Proof of the vulnerability, response excerpts, payloads, or other confirming data |
| Description | Human-readable explanation of the vulnerability and its potential impact |
Saving Output
Using the -o/—output Flag
Write output directly to a file:Piping JSONL
JSONL output can be piped to other tools for processing:Discovery and Spidering Output
The discovery and spidering phases produce their own output alongside scan findings.Discovery Output
Discovery output includes URLs and endpoints found through wordlist-based content discovery, Wayback Machine data, and JavaScript analysis. Each discovered URL is reported with its HTTP status code and response metadata.Spidering Output
Spidering output includes pages found by the browser-based crawler, along with forms, links, and dynamic content discovered during crawling.OAST Interactions
Out-of-band Application Security Testing (OAST) findings come from DNS and HTTP callback interactions. When a scanner payload triggers an out-of-band request to the OAST server, the interaction is correlated back to the original test case. OAST findings appear in output with:- The original request that triggered the out-of-band interaction
- The type of interaction (DNS lookup, HTTP request)
- Timing information (when the callback was received)
- Correlation data linking the interaction to the specific payload
Querying Results from Database
All scan data is stored in the database (SQLite by default). You can query stored results using CLI commands without re-running scans.Listing Findings
--confidence keeps only findings whose confidence matches one of the comma-separated levels (certain, firm, tentative) and renders a colorized CONFIDENCE column, complementing --min-severity.
Listing Traffic
--project-name/--project-uuid to target a specific project, or set a default for your shell with eval $(vigolium project use <uuid>). See the Projects & Multi-Tenancy reference for details on multi-tenancy and project scoping.
Reading a Standalone Export
finding and traffic can read a file directly instead of your project database, which is handy for inspecting a --format jsonl export or a foreign .sqlite file from another machine. Pass -S/--stateless together with --db <file>:
-S/--stateless turns project scoping off, so every row in the file is shown regardless of the project_uuid it carries. Nothing is written to your project database (a JSONL source is loaded into a throwaway in-memory SQLite). The source type is auto-detected by extension, falling back to a header sniff (.jsonl/.ndjson vs the SQLite format 3 magic / .sqlite/.sqlite3/.db).
Rendering a Finding or Record as Markdown
--markdown prints the selected findings/records as Markdown — evidence plus request/response in fenced http blocks — to stdout. Pipe it to a file or a viewer like glow, and pair it with --id, a fuzzy search term, or -n 1 to focus a single item:
-S/--stateless, add --compact to window the response around the finding’s match (matched_at / extracted_results) — or cap a record’s body to a preview — so a long page doesn’t flood the console. Without --compact, bodies render in full.